
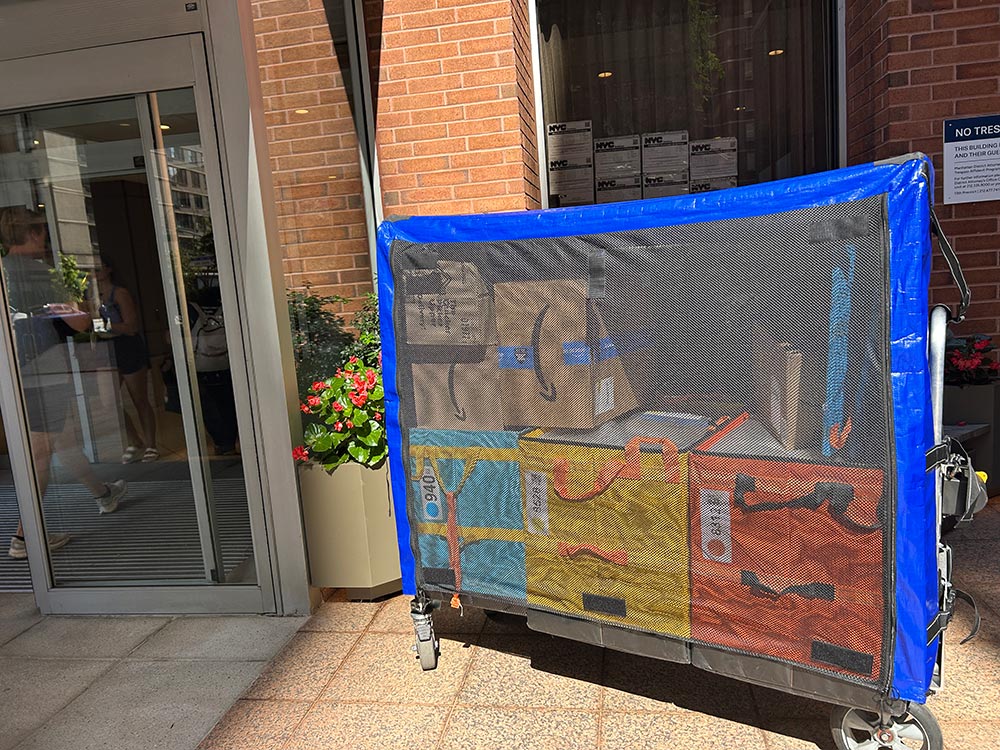

Someone asked you what package handling costs your property, and nobody in the building could answer. The number isn’t hard to produce, but it doesn’t appear in your reporting. It sits inside payroll, blended with leasing hours and everything else a front desk does in a day. To calculate cost per package in multifamily buildings, you must purposefully pull it back out.
A multifamily package delivery solution is defined as a single open shelving room that scales through peak delivery periods. Before you price one out, you need to know what the current process costs today. This article gives you a calculation you can run from inputs that you already have. Fair warning on the finding: most published cost-per-package figures rest on a wage assumption that current federal data doesn’t support, and correcting it roughly doubles the answer.
You’ll work through four buckets: parcel volume, a fully loaded labor rate, the soft costs that never reach the ledger, and the break-even point at which you make a decision. If you’ve already worked through the luxury apartment concierge vs automated package rooms question, this is the arithmetic that sits underneath it.
Why Cost per Package in Multifamily Buildings Belongs in Your Budget
For the purposes of this article, cost per package is defined as the total annual cost of receiving, storing, notifying, and releasing parcels, divided by annual parcel volume.
The reason that it’s not often quoted by multifamily operators is that both halves are buried. Parcel volume is rarely counted, and the cost side disappears into payroll. The National Apartment Association reports administrative and payroll expenses at $2,323 per unit in 2024, up 3.81 percent year over year, against total operating expenses of $8,657 per unit. That single line covers leasing, administration, and every hour your team spends on parcels, with no breakdown by task.
So, the cost is real, it’s already being paid, and it’s invisible in the format it’s currently reported in.
Tracking it separately lets you compare a process change against a headcount change on the same axis. A new hire is priced in salary. A package room is priced in capital. Neither of those numbers can be set against the other until both are converted into dollars per parcel. The good news is that once they are, the comparison takes only a minute.
The rest of this article builds that figure in four steps: your real parcel volume, a fully loaded labor rate, the soft costs that never reach the ledger, and one worked example you can substitute your own inputs into.
Step One: Establish Your Real Parcel Volume
Volume is the denominator, so an error here scales through everything else. You have two paths to it.
If your team keeps a delivery log, pull the total parcel count for the last twelve months. That’s the better number, with one caveat covered below.
If you don’t have a way to account for last year’s overall parcel deliveries, you can calculate the figure. The Pitney Bowes Parcel Shipping Index put US parcel volume at 23.1 billion shipments in 2025, up 3.3 percent year over year, equal to 171 parcels per household per year, and projects 31 billion by 2031. Multiply your unit count by 171. A 250-unit building lands at roughly 42,750 parcels a year, about 117 a day.
Even with that figure, the daily average only tells part of the story. Delivery periods around the holidays and move-in weeks can run several times the daily average. These peak seasons such as holiday shopping, Amazon Prime Days and move-in, move-out periods are what break the process, generate overtime, and produce piles of parcels in the lobby. Model the peak week separately, because that’s when your staffing needs to adjust to survive.
Now for the caveat on delivery logs. Counting only parcels that staff logged tends to understate package volume in the buildings with failed package management processes. This is because the parcels that never got logged are the ones that generate searches, disputes, and replacements. Unlogged parcels still count as parcels, and they’re expensive ones.
Step Two: Build a Fully Loaded Labor Rate
Your labor rate is where the published figures fall apart. It’s also where this calculation bears real fruit. Three inputs go into it, and most cost-per-package math gets all three wrong at once.
Start with a Current Wage, Not a Round Number
A $15 or $20 hourly wage circulates across vendor content as though it were a constant. It isn’t, and it hasn’t been for years.
The Bureau of Labor Statistics puts the median hourly wage for property, real estate, and community association managers at $30.91, with average hourly earnings for nonsupervisory real estate employees at $29.79 as of May 2026. For a leasing-agent proxy, $23.97 is the closer figure, since leasing staff handle most parcel work at properties without a dedicated concierge.
Pick the wage that matches the staff member role that does the package management work in your building. That sounds obvious but it’s often skipped because the person handling parcels is rarely the person the budget assigned to it. If a $30.91 manager spends an hour a day on parcels, that hour costs manager money, not leasing-agent money.
Write your chosen figure down before moving on. Every dollar in this calculation is a multiple of it.
Add the Benefits Load
A wage is not what an employee costs. Benefits, payroll taxes, and insurance ride on top of it, and the Bureau of Labor Statistics measures the gap directly.
Total employer compensation costs for private industry workers averaged $46.60 per hour worked in March 2026, of which benefits accounted for $14.01, or 30.1 percent of total employer cost.
Read that percentage carefully, because it’s generally the most common numerical error seen in this whole calculation. Benefits are 30.1 percent of the total, not 30.1 percent added on top of the wage. Adding 30 percent to a wage multiplies it by 1.30. Recovering a total when the wage is the remaining 69.9 percent of it means dividing by 0.699, which multiplies the wage by roughly 1.43.
The difference isn’t academic. A $23.97 wage becomes $31.16 under the wrong method and $34.29 under the right one, a 10 percent understatement that compounds across every parcel you handle all year. This is one example of how a small error can set you on the wrong path.
Count Every Minute the Parcel Touches a Person
Build the minute count from the actual sequence. A parcel gets received, scanned in and shelved, then prompts a resident question, triggers a search and gets handed over to the resident. That’s for a successful delivery; sometimes packages become an exception that nobody can resolve.
Routine parcels move fast, roughly two minutes end to end. The exceptions take up more time. A parcel that can’t be found runs fifteen minutes or more once you factor in the search, the reply, and the follow-up. If eight percent of parcels become exceptions, your blended average is more than three minutes per parcel, with the exception cases driving half of it.
Run the arithmetic on the 250-unit example. At 42,750 parcels at three minutes each, that’s 2,138 staff hours a year, which nets out at just under six hours a day. At the loaded rate of $34.29, that’s $73,312 a year in labor before a single soft cost. To see the impact that you’d experience, you can test the labor line in your own building against your own volume and staffing.
Time your own process for at least one week before you trust any of it. Building layout moves this figure more than unit count does.
Step Three: Add the Costs That Never Reach the Ledger
Four costs sit outside of payroll.
Parcel loss and goodwill. When a parcel goes missing, the resident’s first call is to your office, and well-run properties will replace the item to protect the relationship. Security.org found that apartment and condo residents were victimized 3.5 times more often than single-family homeowners, with an average stolen package value of $222. Determine your figure by counting last year’s goodwill replacements and multiplying by their average value.
Complaint handling. If your minute count includes the resident question and the search, you’ve already captured this and adding it again inflates your total. Count it separately only for complaints that escalate past the front desk.
Resident churn. Estimable, not measurable. Delivery friction contributes to move-outs, but no property can isolate its share cleanly.
Diverted leasing hours. This is the strongest argument in the calculation. Those 2,138 hours came out of somewhere, and at most properties they came out of tours and renewal conversations. Multiply the diverted hours by your tour-to-lease conversion rate and the annual value of a lease, and you get a revenue figure that dwarfs the labor line.
Keep the estimated items visibly separate from the measured ones in the data that you present. A defensible smaller number will survive an operations manager’s questions. An impressively larger one usually won’t.
Step Four: Calculate Cost per Package, Then Sanity-Check It
Here is the full calculation at 250 units, with every input stated so you can substitute your own.
| Input | Value | Where it came from |
|---|---|---|
| Units | 250 | Your rent roll |
| Annual parcels | 42,750 | 250 units x 171 parcels per household |
| Blended minutes per parcel | 3.0 | 2 minutes routine, 15 for the 8% that become exceptions |
| Annual staff hours | 2,138 | 42,750 x 3 minutes, divided by 60 |
| Loaded hourly rate | $34.29 | $23.97 leasing wage, divided by 0.699 |
| Annual labor cost | $73,312 | 2,138 hours x $34.29 |
| Measured soft costs | $4,440 | 20 goodwill replacements x $222 |
| Total measured annual cost | $77,752 | Labor plus measured soft costs |
| Cost per package | $1.82 | $77,752 (total measured annual cost) divided by 42,750 (annual parcels) |
Diverted leasing hours sit outside of this total on purpose, because they’re not measured, they’re estimated. Bring them into the calculation and the figure roughly doubles again, which is true and the first thing a skeptical operations manager will challenge. Present the measured number, then note the estimate separately.
Now sanity-check it against the figures in circulation. Hold the minute count constant at three and swap only the wage, from a loaded $34.29 back to a flat $15 with no benefits, and annual labor drops to $32,062, or $0.75 per package. The wage assumption alone accounts for a 2.3x spread. That is the entire gap between most published figures and this one.
Your own number will differ for two reasons. Carrier mix changes the delivery pattern, since one consolidated delivery point nets a different result than forty scattered arrivals across a day. Resident pickup patterns change the search rate too, because parcels that sit for three days get buried behind three days of newer ones.
Trust your minutes-per-parcel input the least. Wage data is federal and volume is arithmetic, but the minute count is the one figure you’re estimating from memory, and it’s the one every dollar in the table is multiplied by. Time it yourself for a week.
What the Number Is Good For
The figure supports three important decisions.
Whether to change the process. Whether to add a person. Whether an amenity fee is defensible. Each of those becomes answerable once the cost per package figure exists.
The break-even point is the metric that most decision makers want. A fixed-cost system spreads across every parcel that it handles, so its cost per package falls as volume rises. A staffed process holds roughly flat per parcel and rises as wages rise. Those two lines cross at a volume that’s specific to your building, and finding the crossing point requires the two figures you now have.
That framing also explains why the same decision lands differently at 120 units and at 400. Below the crossing point, the staffed process is genuinely cheaper, and a vendor telling you otherwise is selling without calculating.
There is one trend that makes that comparison one-directional. RealPage Analytics reports that multifamily operating expenses per unit sits roughly 39 percent above pre-pandemic levels, with payroll being one of only two of nine tracked categories that didn’t moderate. Wages climb, parcel volume climbs, and the staffed line climbs with both.
One warning about misuse. Cost per package is a planning figure, not a performance target for staff. The moment it becomes something a team is measured against, people stop logging the exceptions, and you lose the input that made the calculation worth running.
Common Mistakes That Wreck the Calculation
Five errors account for most of the bad numbers in circulation. Four of them make your cost look smaller than it is.
Using a base wage instead of a loaded rate. This understates labor by roughly 30 percent, and it’s the single largest source of the spread between published figures.
Counting only logged parcels. The unlogged packages are disproportionately the expensive ones, so this error is largest at the properties with ineffective package management processes. The buildings that most need the number get the most flattering answer.
Averaging across the year. Peak delivery periods generate most of the overtime and most of the loss. A flat annual average hides the weeks that drive the decision.
Treating the amenity as a line item. A package room compared against zero always looks expensive. Compared against the alternative use of the same money, including the staffed process you’re running today, it usually doesn’t.
Borrowing another property’s benchmark. Building layout moves the minute count more than unit count does. A garden-style property with parcels spread across several buildings and a high-rise with one staffed lobby produce very different figures at identical unit counts. Time your own.
The fifth error is the one worth guarding against strongly, because a borrowed benchmark provides an inaccurate picture of the situation.
Frequently Asked Questions about Cost per Package in Multifamily Buildings
1. How Do You Calculate Cost per Package in Multifamily Buildings?
Add your total annual parcel handling cost, labor plus soft costs, then divide by annual parcel volume. Four inputs feed it: parcel count, blended minutes per parcel, a fully loaded hourly rate, and the soft costs that you can measure.
The loaded rate is the input that people tend to get wrong, because benefits run 30.1 percent of total employer cost rather than 30 percent on top of the wage. The worked example above runs all four at 250 units and shows every arithmetic step, so you can swap your own unit count and wage into the same structure without rebuilding it.
2. What Is a Typical Cost per Package for an Apartment Building?
Published benchmarks vary too widely to trust, because they rest on different wage assumptions. Most use a rate well below current federal medians. The honest guidance is to calculate your own and treat any published number that doesn’t state its wage input with real caution.
Two variables move the answer more than anything else: the hourly rate that you assume and the minutes you count per parcel. Change only those two and the same building can produce figures three times apart, which is exactly what has happened across the published estimates.
3. How Many Packages Does a 200-Unit Apartment Building Receive per Day?
Here’s the simple math. At 171 parcels per household per year, a 200-unit building receives roughly 34,200 parcels annually, which is about 94 a day. Delivery periods around the holidays and move-in weeks can run several times that figure, so the daily average understates what your staffing has to absorb in the weeks that matter most.
Check the derived number against one week of actual counting before you build a budget on it. Buildings skew from the national average in both directions depending on resident age, income, and how many households order groceries online.
4. What Should You Include in the Labor Cost of Package Management?
Count the full sequence: receiving and label capture, shelving, answering resident questions, searching for parcels, the handoff, and exception handling when a parcel can’t be found. Exceptions consume disproportionate time, often fifteen minutes or more against two for a routine parcel, so a blended average that ignores them understates the total badly. Then apply the loaded rate, because base wage understates true cost by roughly 30 percent once benefits, payroll taxes, and insurance are counted.
5. Does Cost per Package Include Package Theft and Loss?
Loss belongs in the cost per package calculation when the property absorbs it, which happens through goodwill replacements, staff time on disputes, and resident churn. Apartment exposure runs high. Security.org found that apartment and condo residents are victimized 3.5 times more often than single-family homeowners. Separate hard replacement cost, which you can count from last year’s records, from estimated churn effect, which you can’t. The total stays defensible under challenge that way, and the hard number alone is usually large enough to make the point.
6. How Do You Compare Package Automation Against Hiring Someone?
Convert both figures to dollars per parcel. A fixed-cost system spreads across every parcel it handles, so its cost per package falls as volume rises, while a staffed process holds roughly flat and climbs with wages. The two lines cross at a volume specific to your building. One practical note sits outside the math entirely. Capital and operating budgets often come from different approval paths and different timelines, which can decide the question independently of which line is lower on the chart.
7. Can You Charge Residents a Package Fee to Offset the Cost?
Some properties recover part of the cost through an amenity or package fee, and other income per unit has been rising across the industry. The limits are real though. Local rules on fees vary by jurisdiction, and a fee attached to a process residents already find frustrating generates complaints rather than income. Fix the process first, then price it. A fee on a service that works is a very different conversation from a fee on one that doesn’t.
8. How Often Should You Recalculate Cost per Package?
Recalculate annually with your budget cycle, and perform an interim check whenever wages change or parcel volume shifts materially. The figure drifts on its own: wages rise, volume rises, and a change in carrier mix will reshape the delivery pattern. A stale number is worse than no number, because it gets quoted with confidence but may be inaccurate. Date-stamp the figure wherever you record it.
9. Why Do Published Cost-Per-Package Figures Differ so Much?
Three variables account for nearly all of the spread: the wage assumed, the minutes counted per parcel, and whether soft costs were included at all. Most published cost per package figures use a wage well below current federal medians, which is the largest single source of the gap. Apply one test to any figure that you encounter, including this one. Ask what hourly rate it assumed, and whether that rate was loaded. A figure that can’t answer both halves of that question will ultimately be unreliable.
10. What Does the Calculation Miss?
It captures cost well and value poorly. No formula prices in the renewal a resident signed because deliveries were reliable, or a review that they didn’t write. Those show up in occupancy and reputation months later, disconnected from the parcel that caused them.
This is why the figure should be one of many factors that support a budget decision. An understated total is still far more useful than no total, provided you know which direction it’s understated in. Every simplification in this calculation pushes the number down, so treat your result as a floor.
The Bottom Line
Your package management cost is knowable, it’s already being paid, and most published versions of it are low by roughly half. Once you calculate cost per package in multifamily buildings on current wage data, a process change and a new hire become comparable on the same axis for the first time.
The fundamentals to remember:
- Volume first, because every other figure in the calculation is a rate applied to it.
- Loaded rate, not wage, since benefits add roughly 30 percent that base pay hides.
- Count the exceptions, as the parcel that staff can’t find costs many times what a routine one does.
- Soft costs belong in, provided you separate what you measured from what you estimated.
- The number is a decision tool, useful for comparing a process change against a hire on the same axis.
Bring three figures to the conversation: your unit count, your annual parcel volume, and who on your team handles deliveries today. We’ll run the comparison against your building rather than hand you a generic figure, and you’ll leave with the ability to calculate cost per package in multifamily buildings on your own inputs. Request a consultation from our experienced team to walk you through it.